The UK Government’s VAT Plan On Private School Fees Might Win Votes, But Does Nothing To Close Socioeconomic Gaps At Best
Author: Hiu Ho Kwok
September 30, 2025
The UK’s education system remains one of the more divided in the developed world, with private and state schools operating in separate spheres. Even as the students go through largely the same assessments and eventually attend the same universities, the skills and networks developed differ vastly. Just 7% of UK children attend private schools (UK Government, 2025). Meanwhile, these institutions dominate elite universities, top professions, and positions of power. Many would argue, as I do, that this system perpetuates a cycle where privilege begets privilege. On the other hand, state schools grapple with funding shortages, teacher retention crises, and postcode lotteries that leave many students at a disadvantage before they even sit their GCSEs at around 16.
Against this backdrop, it is no wonder that Labour’s private school fee VAT plan was part of the policy packages on which the party was propelled to power. It duly became policy from January 2025. A survey found that 54% of correspondents supported the policy (Private Education Policy Forum, 2024). However, imposing VAT on private fees does little to bridge the chasm between state- and privately educated pupils; it neither redistributes resources effectively nor dismantles the social hierarchies that keep the valuable private-school network intact. True reform would require not just taxing privilege, but actively dismantling the systemic advantages that make private education a golden ticket in the first place.
Socioeconomic mobility is the notion that oneʼs social and economic standing can change. This mobility can be conceptualised through the distribution and hierarchy within the jobs market and the possibility of repositioning in the class structure (Hassler and Mora, 2000). Socioeconomic mobility requires conditions that allow for upward movements in income, wealth, network, living conditions, and opportunities (Brown et al., 2010). Access to quality education is a vital part of that mobility. Attending a more prestigious university confers both signaling effects to potential employers that the candidate is competitive in addition to networks for future career development (Spence, 1973). Such attendance is disproportionately filled by private school pupils. In 2023, 32.4% of Oxford’s undergraduate admissions came from independent schools whereas only 5.9% of total students in the UK attended private schools (Independent Schools Council, n.d.). In 2019, the UK saw over 50% of its senior judges, top civil servants, and Lords in parliament graduate from private schools (Sutton Trust, 2019). This paper argues that the UKʼs plan to impose value added tax (VAT) on private school fees diminishes socioeconomic mobility.
State, or public, school is not a substitute good for private schools and, as the demand for good state schools increases, competition would intensify as well. This competition translates to an increase in demand for postcodes within desirable catchment areas, boosting house prices near sought-after state schools.
Most parents have two options when it comes to their childrenʼs education: enroll in either state or private schools. State schools prioritize children who live within the schoolsʼ proximity (UK Government, 2025). Meanwhile, private schools have separate admissions policies. Typically, private schools administer entrance exams and interviews to determine the applicantsʼ suitability. Crucially, where the applicant lives is not a criterion for prioritizing admissions, but the applicant’s ability to pay is.
Therefore, diverging competition rules for private and state school admissions exist. Parents compete on their ability to pay and their children compete on their ability to satisfy entrance criteria vis-a-vis private schools. For comprehensive state schools, parents compete on the ability to put on their application postcodes within catchment areas. Housing price data from 2022 shows that there is a price difference between properties within half a mile and those further away from the public school (Online Money Advisor, n.d.). In Figure 1(A), we observe a 0.45% house price premium in London, which increases to 6.09% in Wales. It is important to note that this research does not differentiate schools of different quality.
Figure 1
(A)
House price premium in schoolsʼ proximity in Britain
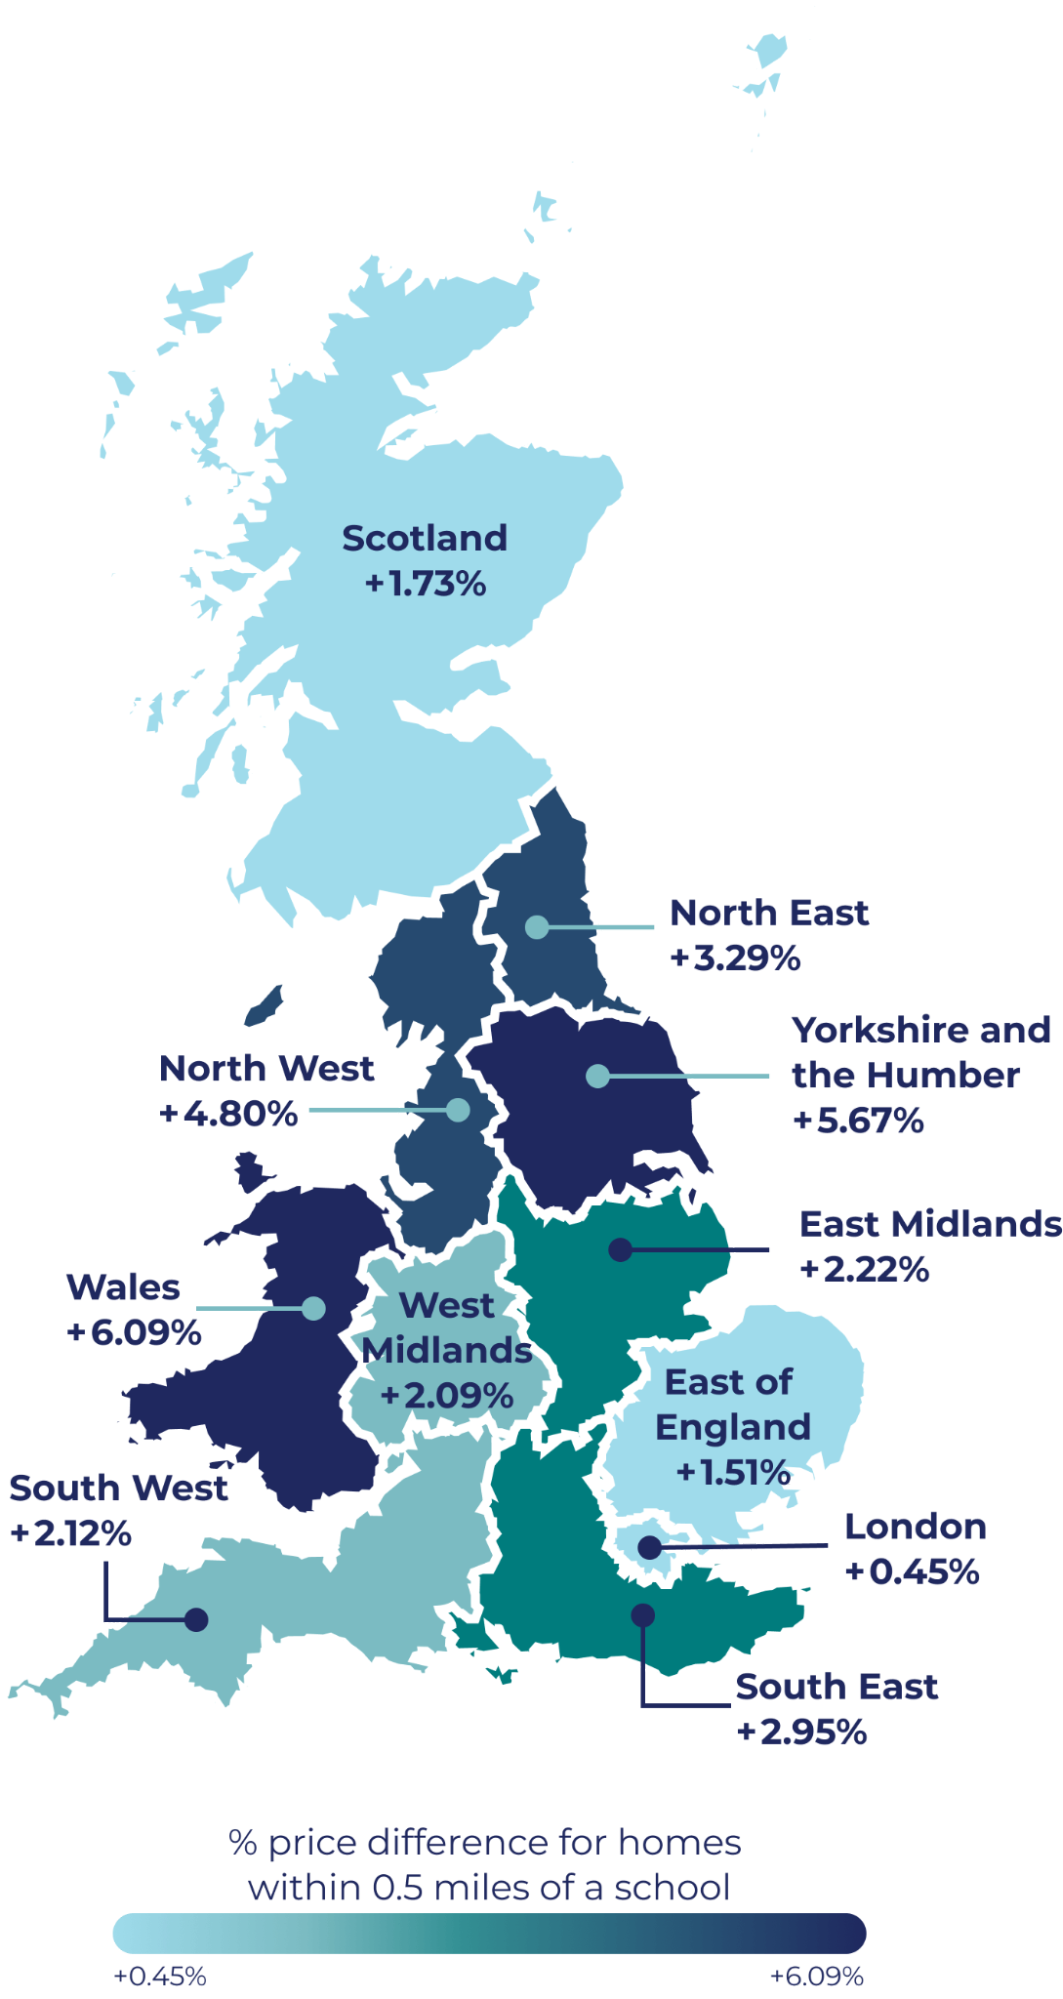
Source: Online Money Advisor (2022).
Note. The chart illustrates that proximity to a school generally increases property values across Great Britain (GB) regions, with Wales (+6.09%) and Yorkshire and the Humber (+5.67%) seeing the largest positive premiums.
London has the smallest positive premium at just +0.45%, which could be due to its already high property prices and the multitude of other factors influencing cost, making the “school proximity” factor less significant than in other regions.
(B)
Comparison of house prices in region against school performance
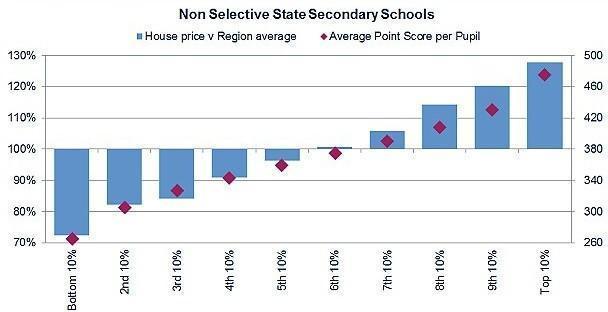
Source: Savills (2015).
Note. This chart shows a clear correlation in the UK housing market: houses located near higher-performing non-selective state schools command a significant price premium over the regional average. The better a school’s academic results (as measured by point score), the higher the extra cost for nearby property. The “Top 10%” of schools are associated with the highest house price premiums.
(C)
Comparison of house price in postcode district against school performance
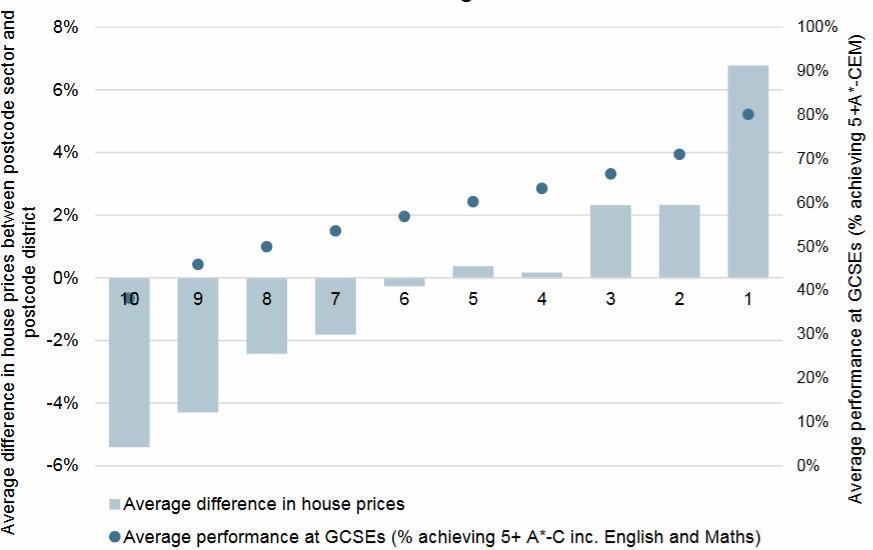
Source: UK Department for Education (2017).
Note. This chart illustrates a correlation in the UK property market that there is a strong positive association between school performance and house prices.
Areas (postcodes) with higher GCSE pass rates consistently show a positive premium in their house prices compared to their wider district. Conversely, areas with lower-performing schools likely have house prices that are below their district’s average.
The chart effectively demonstrates that the perceived quality of local schools, as measured by GCSE results, is associated with housing demand and value within specific locations.
In Figure 1(B), prices are compared between properties in catchment areas of schools against regional averages. It shows that for catchment areas where the average pupil achieves top 10% in academic performance, the associated house price is 25-30% beyond the regional average, where the bottom 10% is linked to a 25-30% shortfall in property price against the regional average. Put together, Figures 1(A) and 1(B) show that while having schools nearby corresponds to a modest (0.45-6.09%) house price premium, this value only exists where properties are near good schools. Figure 1(C) measures house prices in postcode sectors and districts. This analysis finds that applicants’ top 10% performance correlates with 5% in house price uplift, while only the bottom 10% performance correlates with a 5% drop in value.
In Figure 2, before VAT implementation, the supply curve of private school places is Supply1, which is upward sloping as private schools are willing to supply more places when fees increase. Demand1 is the demand schedule, which shows an inverse relationship between the price of private schools and the number of places demanded. The initial equilibrium is the intersection of Supply1 and Demand1 at E1, with resultant price P1 and quantity demanded Q1. When VAT is implemented, the cost of providing private school education rises. We can expect supply to shift up from Supply 1 to Supply 2.
On the demand side, as private school becomes more exclusive, resources concentrated on remaining students, families perceived to have more prestige, and the value of private education increases. The networks become more exclusive because on average their remaining classmates can pay more and evidently come from even more advantageous socioeconomic backgrounds. The result is that for those remaining in this pool, their social capital increases in value, as parental income and childrenʼs academic performance are positively correlated (Ghazi et al., 2013; Mundhe, 2018). As higher fees drive out students of the least-able-to-afford parents, the remaining would have more resources at home to excel, whether through hiring tutors or engaging in other meaningful activities. Demand1 shifts to Demand2 and the resulting net impact is that price increases from P1 to P2, and quantity demanded of private school education decreases from Q1 to Q2 at equilibrium E2.

|
|
Source: UKʼs Department for Education (2017).
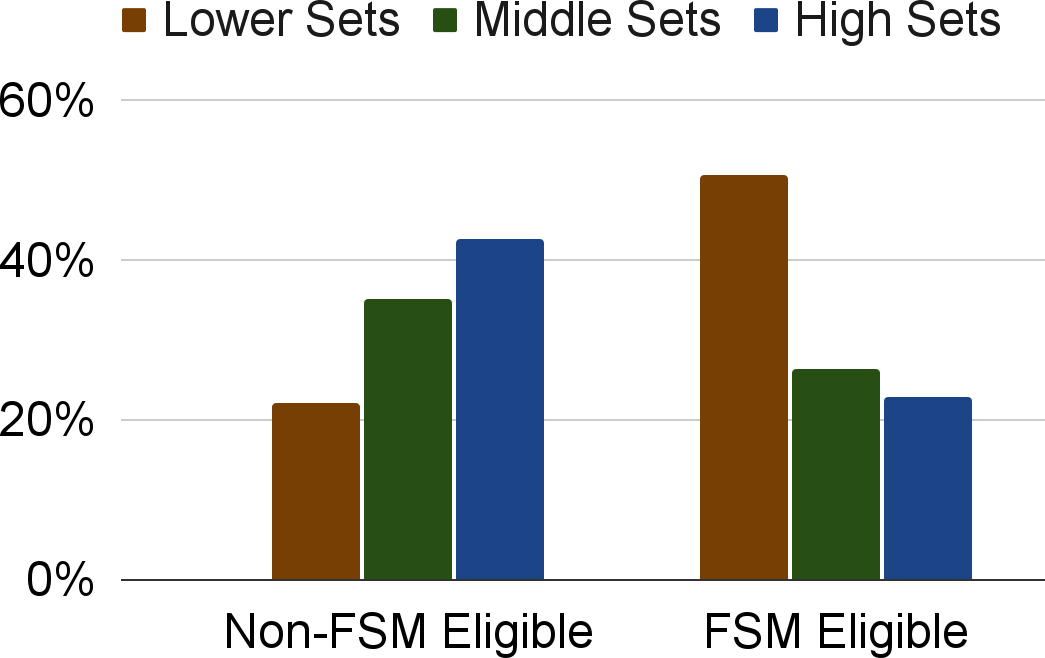
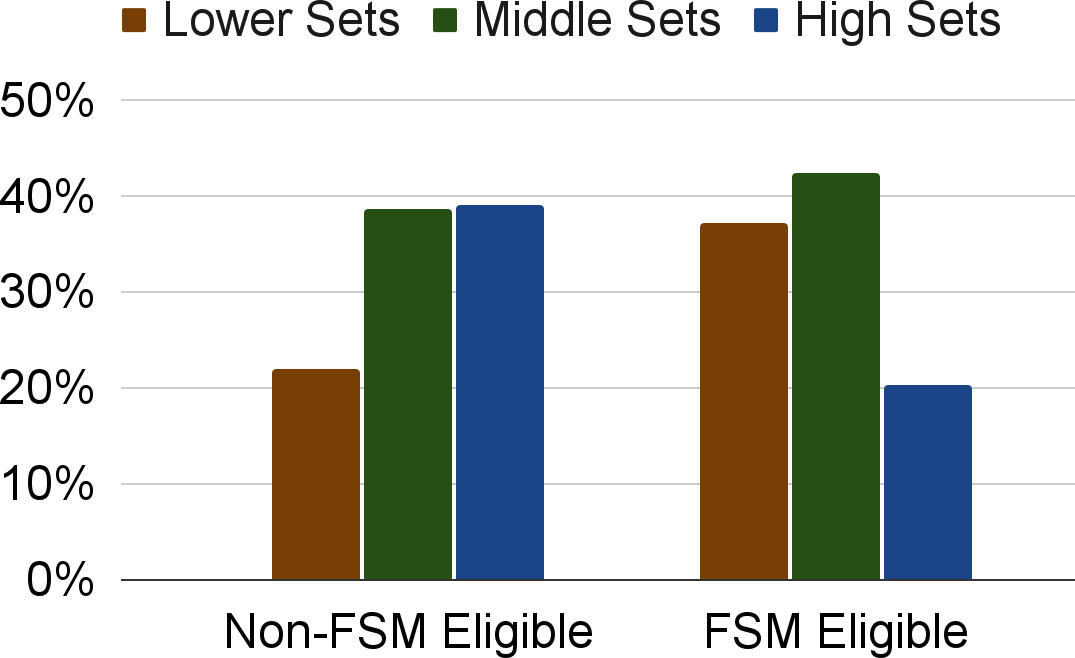
Secondly, some would-be private pupils enter or switch to the state school sector. Within this diverse and enlarging education sector, the marginal consumers - parents who just miss the private sector - likely compete for other schools. Those aiming for selective grammar schools may redistribute resources to entrance exam preparation, e.g. 11+ assessment tutoring. Those aiming for high-performing comprehensives look for desired catchment areas (or less willing to sell up if already owning). This drives up demand for certain postcodes and contributes to the gentrification of some areas. For high-achieving state schools, competition for places becomes stronger, even if this so-called competition now lies in tests or residential real estate. Within state schools themselves, the divide between those eligible for Free School Meals (FSM) and those ineligible is stark in the distribution of pupils in sets (Dunne et al., 2007). In both secondary and primary state schools, FSM-eligible students are more likely placed in low sets than their non-FSM-eligible counterparts (Figure 4). Those switching from private to state schools are almost certainly non-FSM-eligible. The resources and achievement-oriented culture they possess in comparison to the rest of the state school population place them in higher sets for scholastic achievement. As the pupil population increases, more teachers are required to teach them, and to some degree the 6,500 new teacher recruits announced by the government will merely address the sectorʼs churn. Without targeted resources (save contextual measures from elite universities to ʻreachʼ out to ʻtalentsʼ), socioeconomic mobility is set to worsen.
|
(A) Primary school |
(B) Secondary school |
|
|
|
Source: Dunne et al. (2007).
The VAT plan on fees, together with this general trend of socioeconomic diversity in admissions, leads to a more stratified state school system where school pupils are rewarded based on a mix of performance and diversity targets. 1 in 4 of the 9 million students are FSM-eligible as of June 2025 (UK Government, 2025). However, the number of students leaving private schools was merely 11,000 in 2024. Hence, already high-performing state schools can expect more return on reputation by investing in teaching top sets which are going to be disproportionately filled by middle-class pupils. As competition intensifies, social congestion is palpable where the burgeoning state school sector collectively achieves higher A-level grades (Brown, 2013).
This implies that students from the poorest categories are unlikely to be affected by the VAT policy. Access to teaching resources, opportunities, and the acquisition of meaningful social networks remain largely unchanged. Some of the middle class leave private schools for state schools, driving up house prices and pressuring parents to invest in their children to keep up with the competition. Socioeconomic mobility for this middle class is set to increase because of this more open competition. However, we can expect the gap between the upper class and everyone else to widen because private schools have become more exclusive and resources are more available to those who can afford to remain.
The structure of the labor market in some professions itself limits socioeconomic mobility. To become a senior judge for example, an aspiring student would require a law degree, vocational training, pupillage and tenancy at chambers (Inns of Courts, e.g. 2010). While the first two steps are relatively accessible for all students, networks or parentsʼ networks grant significant advantages to gaining pupillage (Chambers Student, n.d.). This is often lumped into the quality of education but is distinctive from learning itself. Without changes to the underlying class obstacles in the labor market, the VAT plan merely stratifies the education structure and restricts socioeconomic mobility between classes.
To conclude, the UK governmentʼs VAT plan to tax school fees likely restricts socioeconomic mobility. Taxing private schools is popular and politically beneficial given a much larger voter base in the state school sector (Ipsos, 2024). However, funds raised from the tax policy do not go straight into helping FSM-eligible students. Furthermore, the policy creates a more exclusive private school circle and induces competition for state schools (catchment areas for comprehensives and 11+ for grammar schools). The latter occurs because the marginal families driven out of private schools likely have the means to compete, either through relocation or already having access to a location within desirable catchment areas. Overall, the upper class leads further from the front with exclusive networks and more resources per student. Mobility among the middle class increases as the competition intensifies. Unfortunately for the most disadvantaged, this VAT policy does nothing direct to improve their prospects of entering elite universities. Assuming selective degrees are still the route to higher income and rewarding careers in the next 2-3 decades, this VAT policy worsens socioeconomic mobility.
Blanden, J., Goodman, A., Gregg, P., & Machin, S. (2004). ʻChanges in intergenerational mobility in Britain,ʼ in Corak M. (ed.), Generational Income Inequality. Cambridge: Cambridge University Press.
Brown, P. (2013). Education, opportunity, and the prospects for social mobility. British Journal of Sociology of Education, 34(5-6), 678-700.
Brown, P., Lauder, H., & Ashton, D. (2010). The global auction: The broken promises of education, jobs, and incomes. Oxford University Press.
Chambers Student. (n.d.). How to become a barrister in the UK. https://www.chambersstudent.co.uk. (Accessed June 17, 2025)
Dearden, L., Ryan, C., & Sibieta, L. (2011). What determines private school choice? A comparison between the United Kingdom and Australia. Australian Economic Review, 44(3), 308-320.
Dunne, M., Humphreys, S., Sebba, J., Dyson, A., Gallannaugh, F., & Muijs, D. (2007). Effective teaching and learning for pupils in low attaining groups. London: DfES Publications. https://dera.ioe.ac.uk/id/eprint/6622/1/DCSF-RR011.pdf (Accessed June 16, 2025)
Friedman, S., Laurison, D., & Miles, A. (2015). Breaking the ʻclassʼ ceiling? Social mobility into Britain's elite occupations. The Sociological Review, 63(2), 259-289.
Ghazi, S. R., Nawaz, K., Shahzad, S., Shahzada, G., & Rukhsar, M. (2013). Relationship between parentsʼ socioeconomic status and their children academic performance. International review of social sciences and humanities, 5(2), 58-65.
Hassler, J., & Mora, J. V. (2000). Intelligence, social mobility, and growth. The American Economic Review, 90(4), 888-908.
Independent Schools Council. (n.d.). Annual census and report on private schools. https://www.isc.co.uk/research/ (Accessed June 25, 2025)
Ipsos. (2024). Over half of Britons support Labourʼs plans to end VAT exemptions for private schools. https://www.ipsos.com/en-uk/over-half-britons-support-labours-plans-end-vat-exemptions-p rivate-schools (Accessed June 23, 2025)
Inns of Court. (2010). Becoming a barrister. https://www.innsofcourt.org. (Accessed June 17, 2025)
Jerrim, J., Parker, P., & Chmielewski, A. K. (2016). Social mobility and education in England. British Journal of Sociology of Education, 37(7), 1053-1073.
Mundhe, E. S. (2018). A study of the influence of parentsʼ education and income level on academic performance of the students. Aayushi International Interdisciplinary Research Journal, 5(3), 190-194.
Online Money Advisor. (2022). Which areas have a higher price premium for homes closer to schools? https://www.onlinemoneyadvisor.co.uk/content/cost-of-homes-near-schools/#regions (Accessed June 20, 2025)
Savills. (2015). Analysis of UK Land Registry and Department of Education data. https://www.savills.co.uk/research_articles/229130/187195-0. (Accessed June 23, 2025)
Shao, Y., Kang, S., Lu, Q., Zhang, C., & Li, R. (2024). How peer relationships affect academic achievement among junior high school students: The chain mediating roles of learning motivation and learning engagement. BMC psychology, 12(1), 278.
Spence, M. (1973). Job market signaling. The Quarterly Journal of Economics, 87(3), 355-374.
Sutton Trust. (2019). Elitist Britain: The educational backgrounds of leading people in the UK. https://www.suttontrust.com/our-research/elitist-britain-2019/. (Accessed June 27, 2025)
UK Department for Education. (2017). House prices and schools: do houses close to the best performing schools cost more? https://assets.publishing.service.gov.uk/media/5a82a832ed915d74e3402e69/House_prices_and_schools.pdf. (Accessed June 28, 2025)
(for college and high school students)
Staff Writer Leader:SpencerCopyright © 2023 The Global Horizon 沪ICP备14003514号-6